● Simulated sensor data · physics-based, planted faults
Every room was designed with a promise.
Indeklima Twin reads that promise from the building's IFC model and MEP design, checks the sensor data against it room by room, explains every broken promise, and writes the answer back into IFC, BCF and Brick.
The MEP engineer sized every room for a number of people and an outdoor-air rate (EN 16798-1, category II). From those two numbers physics gives the CO₂ level the room should never exceed. That is the promise. Move the sliders.
q = 0.7 L/s·m² × A + 7 L/s × N · C = 420 ppm + N·G / q (G ≈ 0.0052 L/s per person)
Defaults = meeting room 2.03. Drop the delivered airflow to 19 % and you get what its stuck damper did.
design outdoor airflow from the MEP design
promised CO₂ at full occupancy (category II)
02 · Promise vs reality
35 of 37 rooms keep it. Two don't, for very different reasons.
Each dot is a room: the CO₂ its own design promises, against what the sensors measured (95th percentile, occupied hours). A generic "CO₂ above 1,000 ppm" alarm would flag the wrong rooms. Click a dot to open its sensor history.
keeps its promisebreaks itwithin promise
measureddesign promisepeople in the room
03 · The live twin
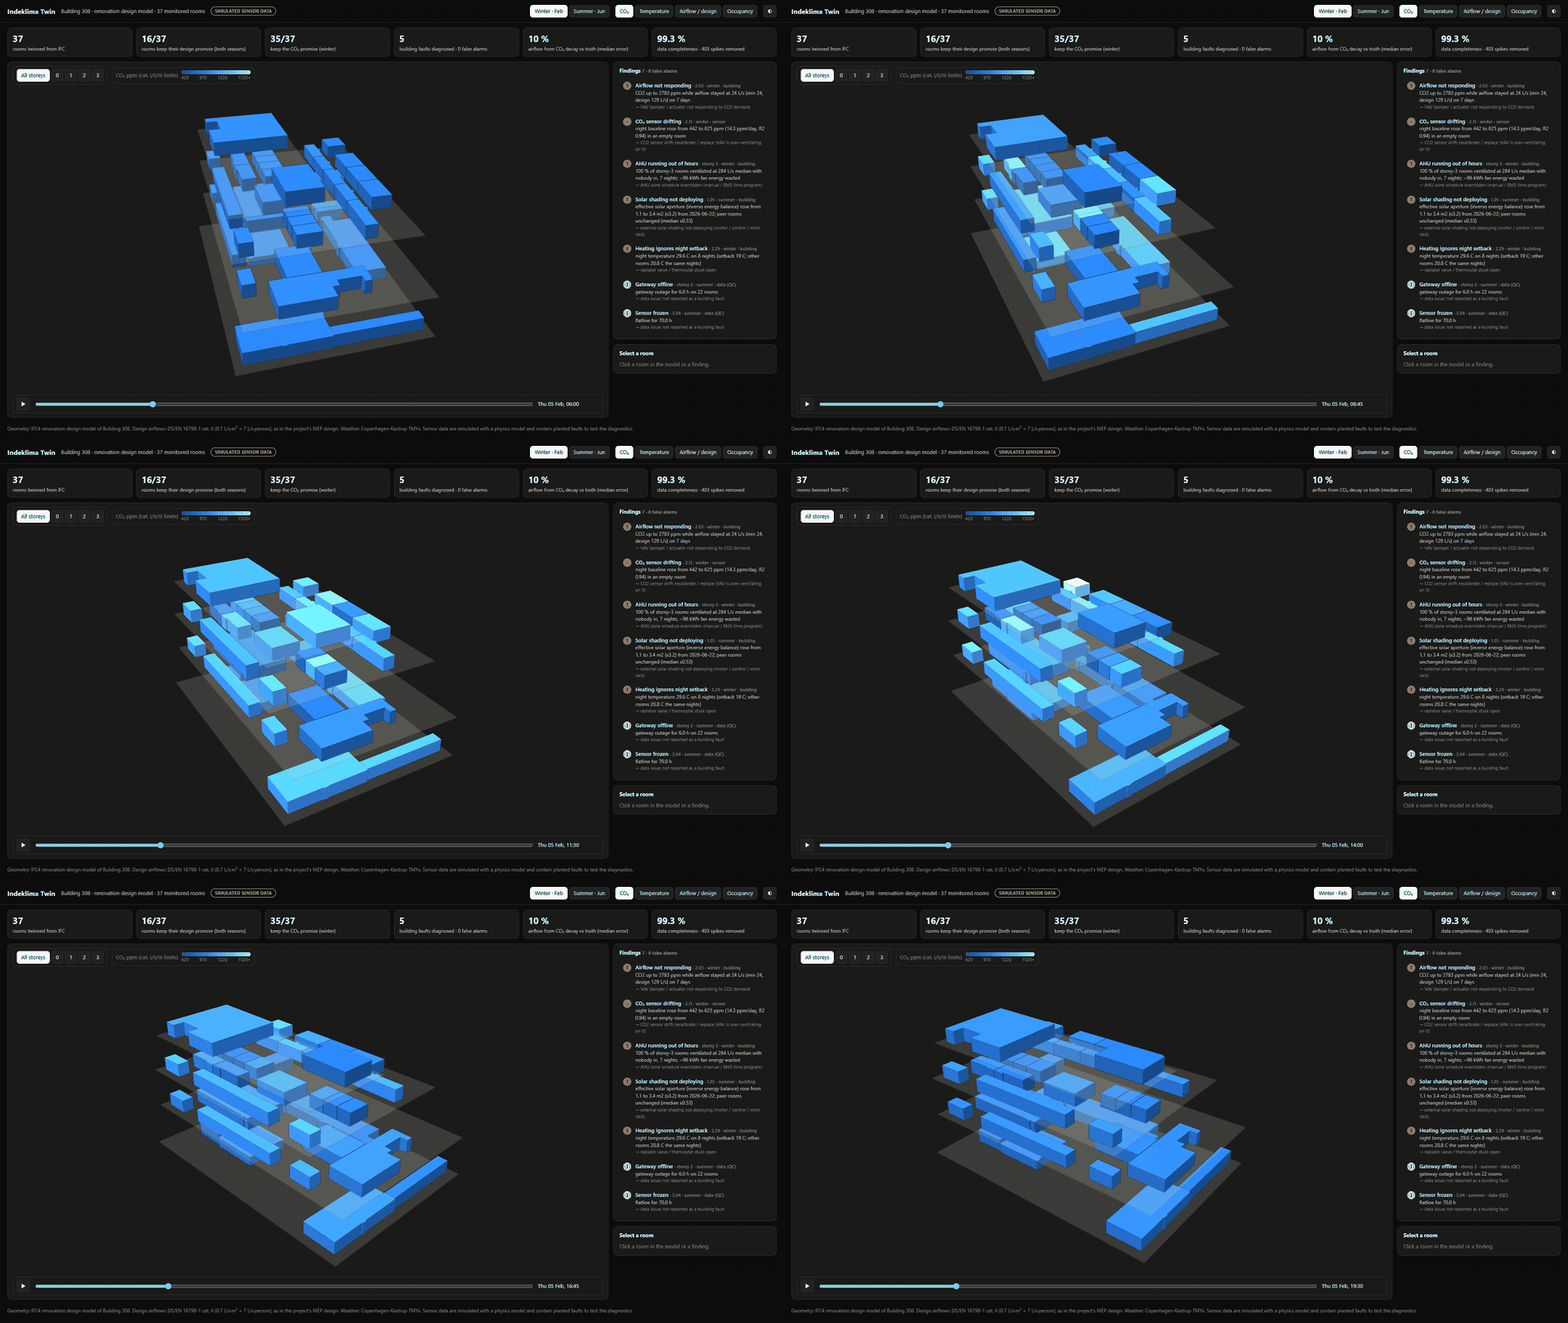
The whole building, room by room, hour by hour.
The 3D dashboard is built straight from the IFC spaces. Storeys explode apart, rooms colour by CO₂, temperature, airflow-vs-design or occupancy, and a time slider replays two weeks. Click any room for its promise card.
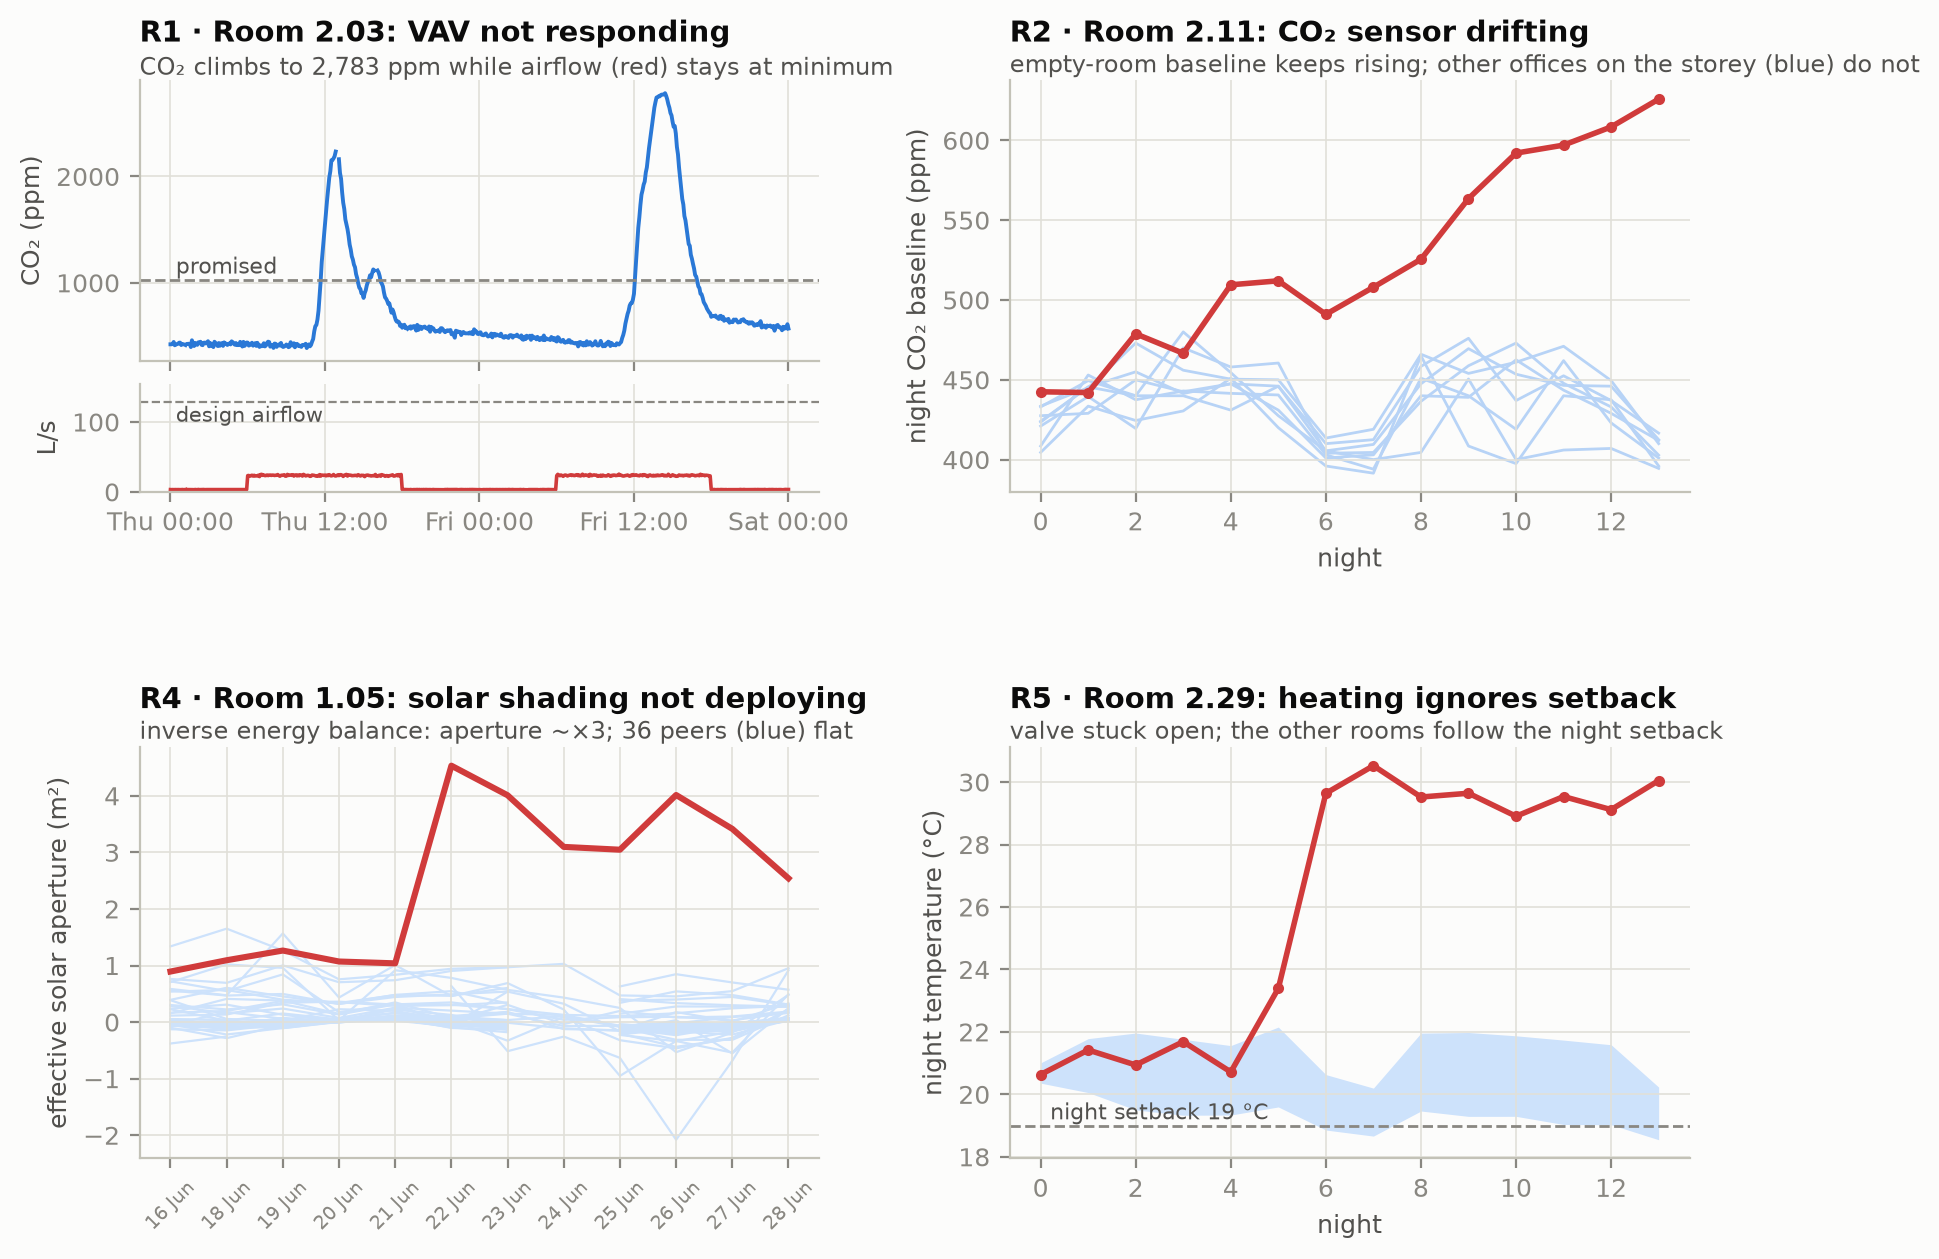
Every broken promise comes with evidence and a cause.
Five rule families, each showing what a commissioning engineer would want to see before sending a technician. Data problems are kept apart: a frozen sensor never sends anyone to a healthy damper.
Summer overheating, every room
Share of occupied hours above 26 °C. The dashed line is the Danish practice limit (100 h/yr ≈ 5 %). Red marks the room whose solar shading stopped deploying.
How the shading fault was found
The VAV cooled harder and hid the temperature rise, so a peak-temperature rule missed it. An inverse daily energy balance did not: the room's effective solar aperture tripled overnight while 36 peers stayed flat.
05 · Ask your building
Or just ask it, in plain language.
An MCP server exposes the twin to any AI assistant (Claude, Copilot, IDE agents) through seven read-only tools. Below is a real recorded session, replayed word for word: the question, the tools Claude chose, and its answer.
SQL runs on an in-memory copy with file access and configuration locked. Writes and file reads are refused, and the test suite proves it through the official MCP client.
06 · Proof
Tested where the truth is known.
The sensor feed comes from a physics model (CO₂ and moisture mass balance, a thermal model, VAV control, Copenhagen weather) with seven planted faults. The detectors never see the truth. Five of the 16 seeds were held out and never used while designing the rules.
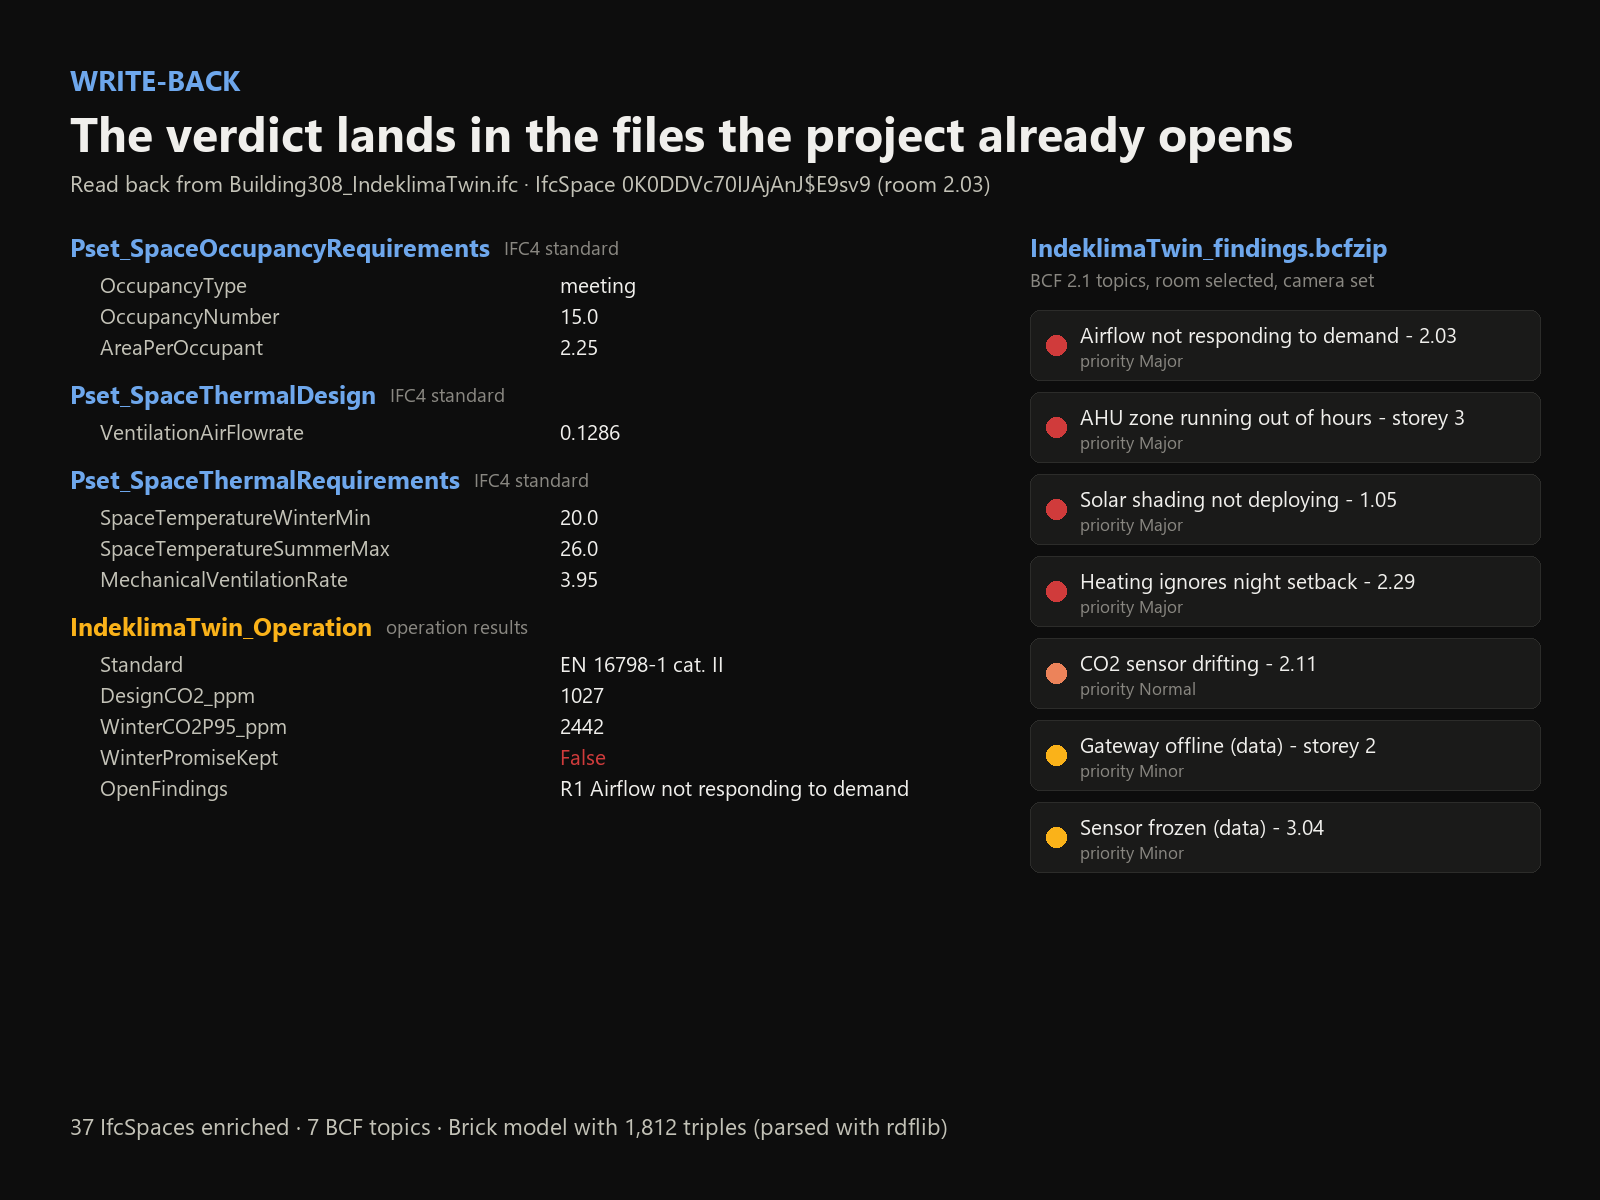
Nothing new to learn. The answer lands where the team already works.
No new platform to adopt. Results go back into the open formats the project already opens.
IFC4
Design intent + verdict on every space
Standard property sets (Pset_SpaceOccupancyRequirements, Pset_SpaceThermalRequirements, Pset_SpaceThermalDesign) plus one operations set with the measured performance.